Day-Time Analysis
I. Quantitative
In analysing thermal comfort experienced by park users during the day, we examined the environmental data collected and observed notable spatial and temporal changes with regards to temperature and number of park users.
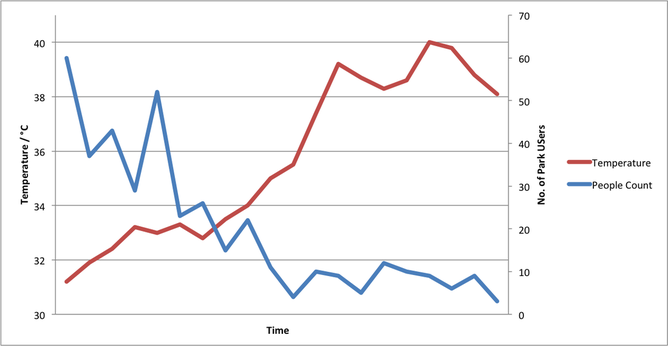
From the data we collected from our morning and afternoon field work, we generated a line graph (Figure A) to illustrate how the number of park users and temperature varies across time from morning to afternoon (0800hrs - 1600hrs). From this temporal analysis, we can see a distinct negative correlation between temperature and the number of park users.
From the data we collected from our morning and afternoon field work, we generated a line graph (Figure A) to illustrate how the number of park users and temperature varies across time from morning to afternoon (0800hrs - 1600hrs). From this temporal analysis, we can see a distinct negative correlation between temperature and the number of park users.
|
Figure A
|
Following our statistical temporal analysis, we translated our statistical data using GIS to make sense of it spatially. We interpolated our data to produce maps for morning and afternoon respectively (Figures B and C). This serves to elucidate how temperature and number of park users vary across the boundary of our field site. For ease of comparison and analysis, we have contrasted the interpolated temperature layers on top of layers showing the number of park users respectively. This can be easily navigated using the slider cursor below.
|
Figure B
 
People Count | Temperature (Morning)
Slide the cursor (on the left) to view |
Figure C
 
People Count | Temperature (Afternoon)
Slide the cursor (on the left) to view |
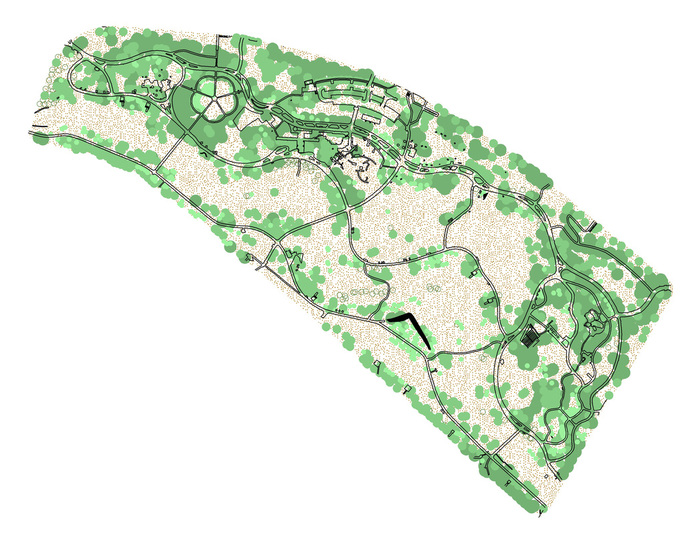
Apart from temperature, tree shade (Figure D) also plays a significant role in providing comfort for the park users. With bright sunny skies, park users derive thermal comfort from his surroundings - whether there is sufficient shading around. The green spots represent tree coverage areas - trees with a wider shade area are represented with a darker shade of green.
Figure D
II. Qualitative
The surveys we conducted gave us a better insight of the park's existing users' preferences. This helped us have a better understanding and supplement our quantitative data collected.
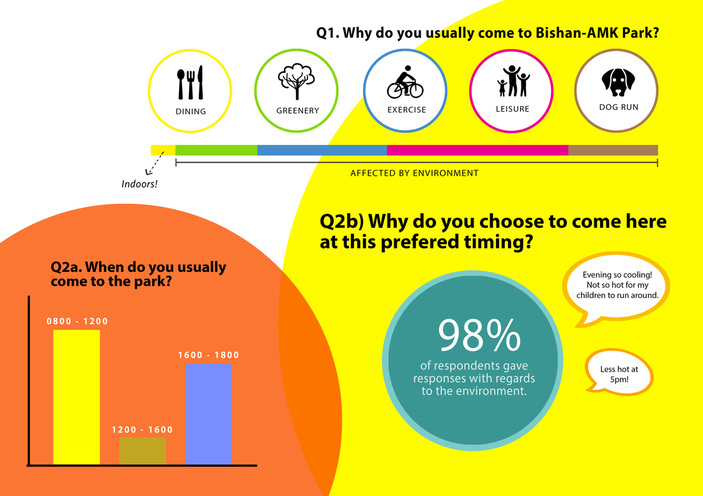
Summary of survey results
From our survey results, it is evident that majority of the activities engaged by park users are directly affected with the environment and the weather as they are predominantly outdoors. This is reflected by the higher concentration of people in the morning and evenings, contrasting with the afternoon. Furthermore, park users express their preference for cooler periods of the day to visit the park. This qualitative data thus shows how the environment influences park users' thermal comfort and decision in visiting the park.
III. Case Study Locations
Now, we will look specifically at different areas of the park through a 360º lens.
|
View under one of the shelters around the park |
This location shows an area with a moderate amount of trees and a sheltered bench.
However, it is evident that the shade provided by them is not sufficient to provide thermal comfort against the morning sun/heat. |
|
Shady spot with benches |
This location shows how the presence of trees allows for a well-shaded environment against the sun.
This creates a cooling environment for park users and their various activities. |
IV. Conclusion
From our quantitative and qualitative data, and case study locations, we have observed a general correlation between park usage and thermal comfort. This can be derived from either natural or artificial shading (trees or man-made shelters) provided around the park. This simple equation sums up our findings.


CLICK FOR PROPOSED SOLUTIONS
